Risk Comparison
Objective: Gain an understanding of the Risk Comparison report
This report allows an organisation to compare the predicted risk behaviour of their asset portfolio as a result of their selected financial strategy.
Under ISO 31010:2009, Predictor utilises the consequence versus probability matrix to perform risk assessments and hence the following reports reflect this framework.
To load the Risk Comparison report in the Brightly Predictor Web App, users log in with their Predictor account and select the Workspace.
Once the Workspace is loaded, users can click on the 'Advanced Comparison' tab to view the Advanced Reports.
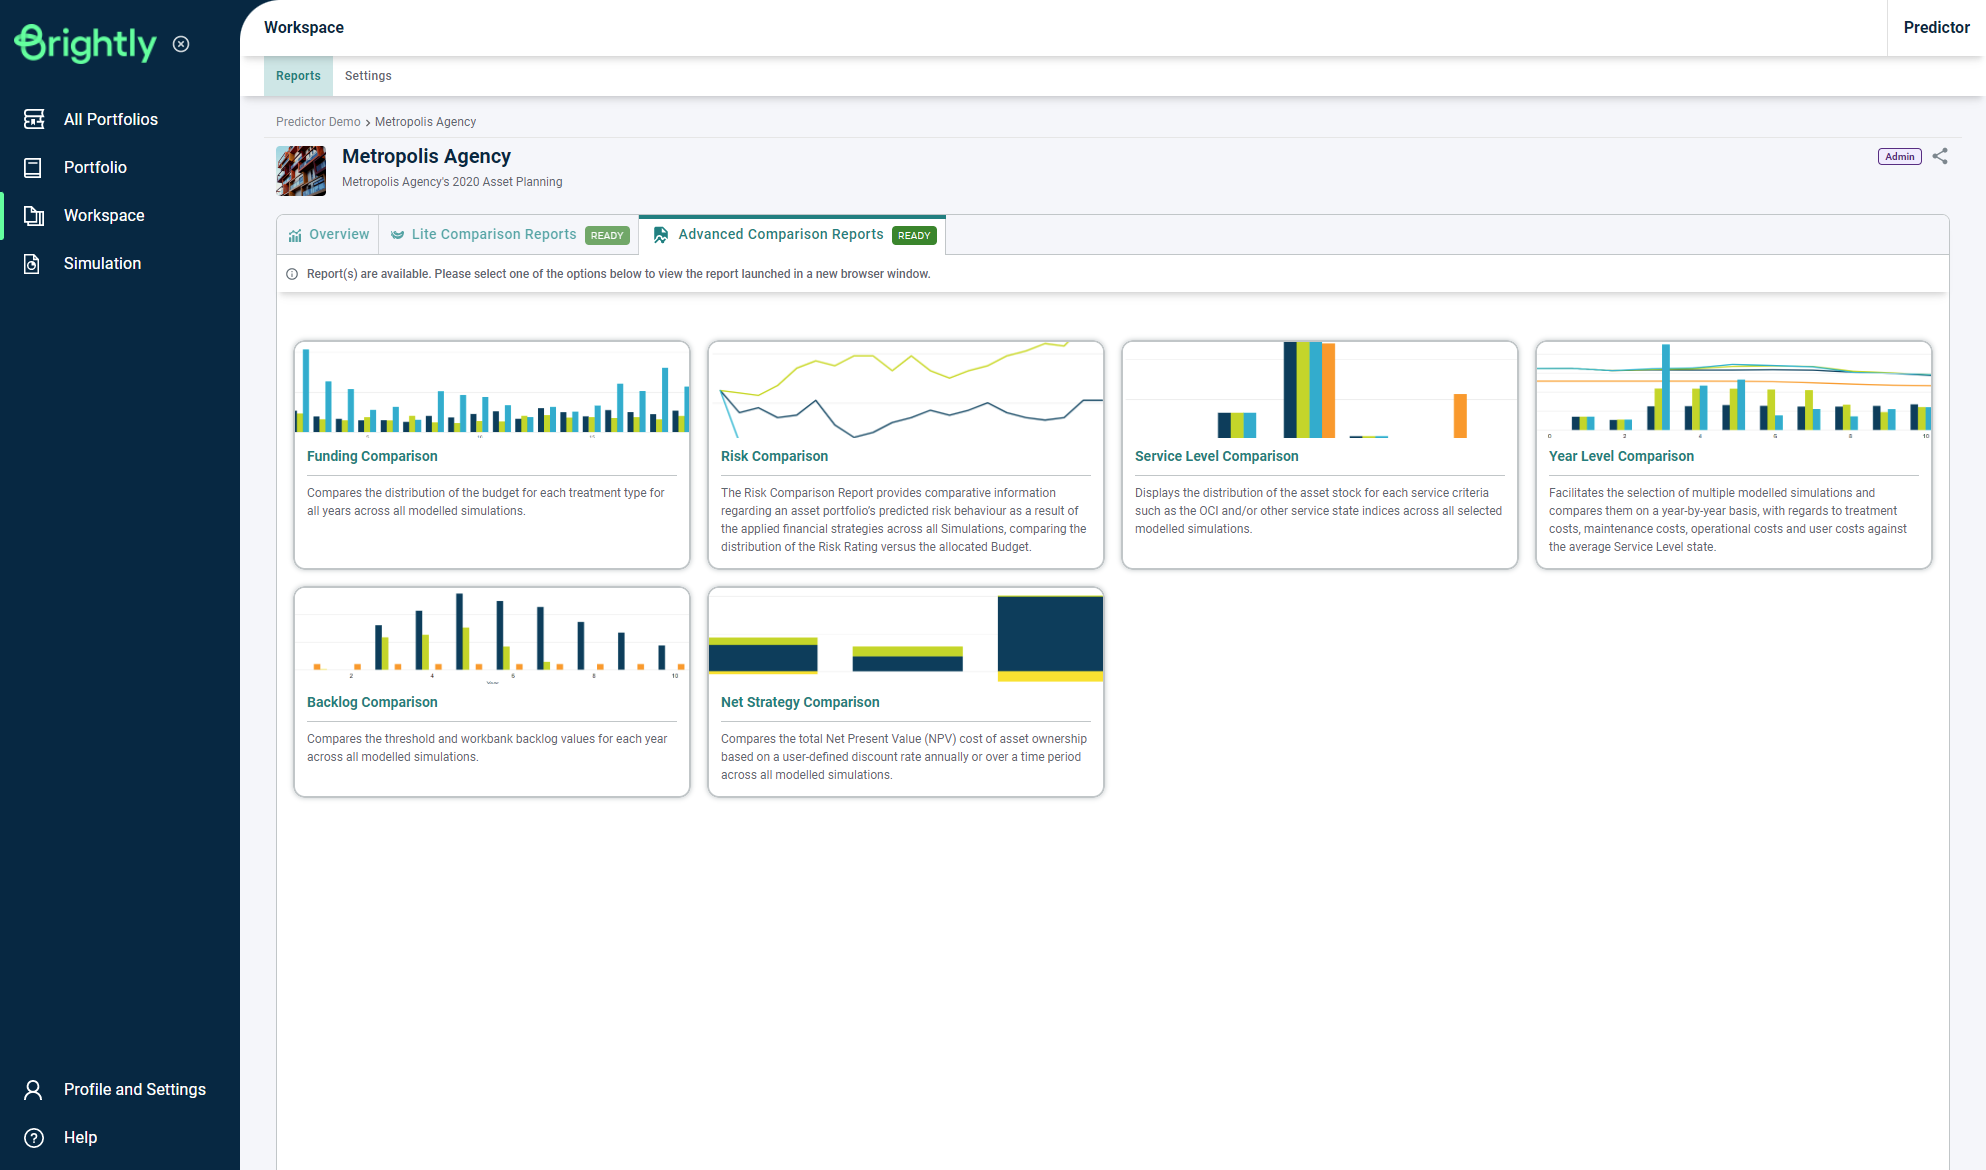
Users can then click the 'Risk Comparison' button to load the report in a new browser tab. Different data sets for Cost Types, Report Types and Risk Ratings are available to be viewed from the options on the left.
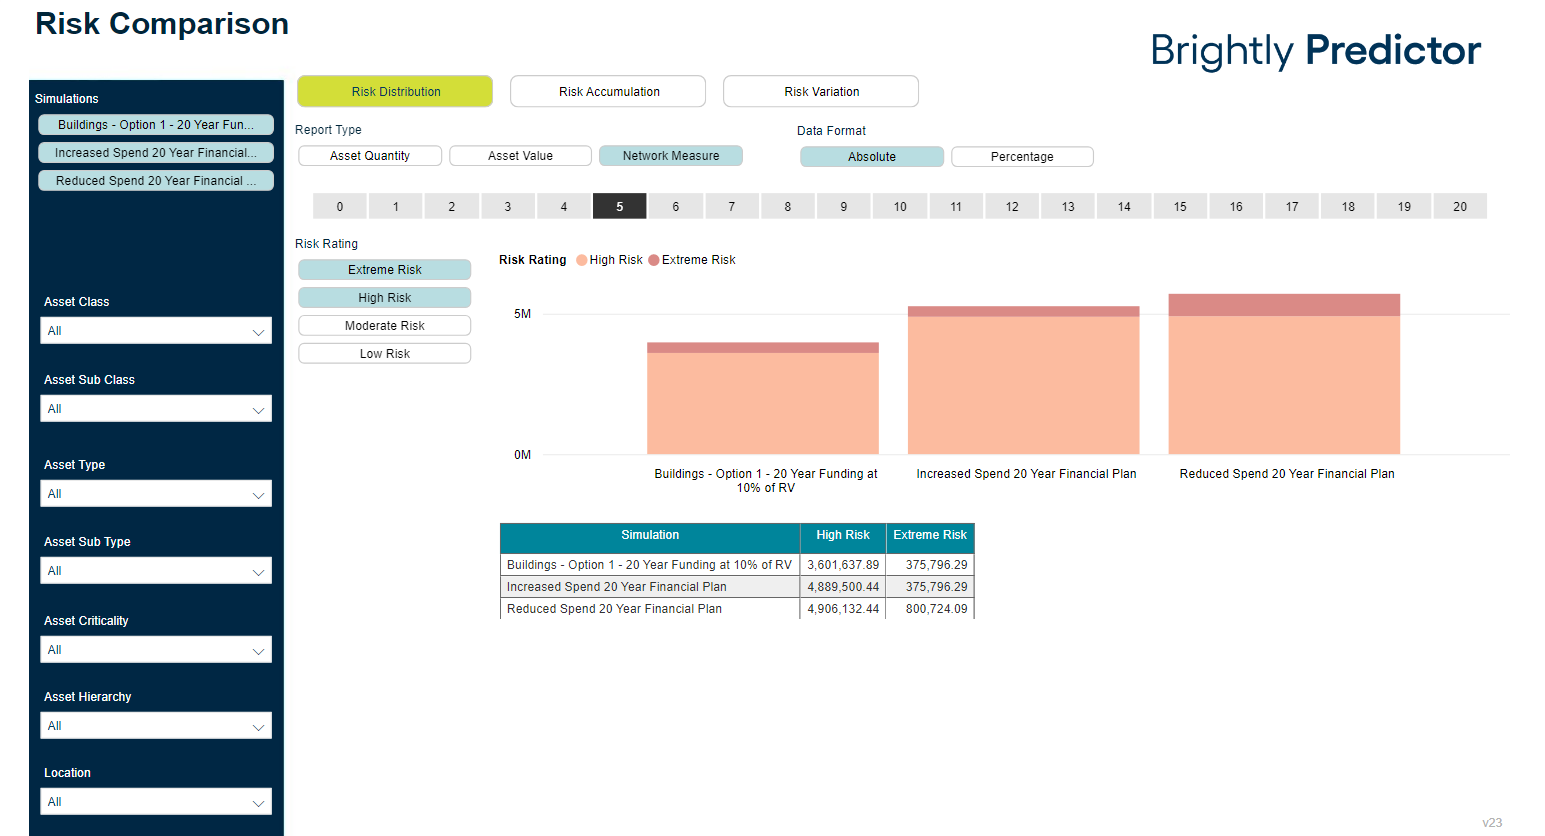
The Risk Report provides Risk Distribution, Risk Accumulation, and Risk Variation views, which can be moved between using the buttons at the top. In each view, users can report by Asset Quantity, Asset Value, or Network Measure. In the Risk Distribution view, users can see the Funding Distribution by year.
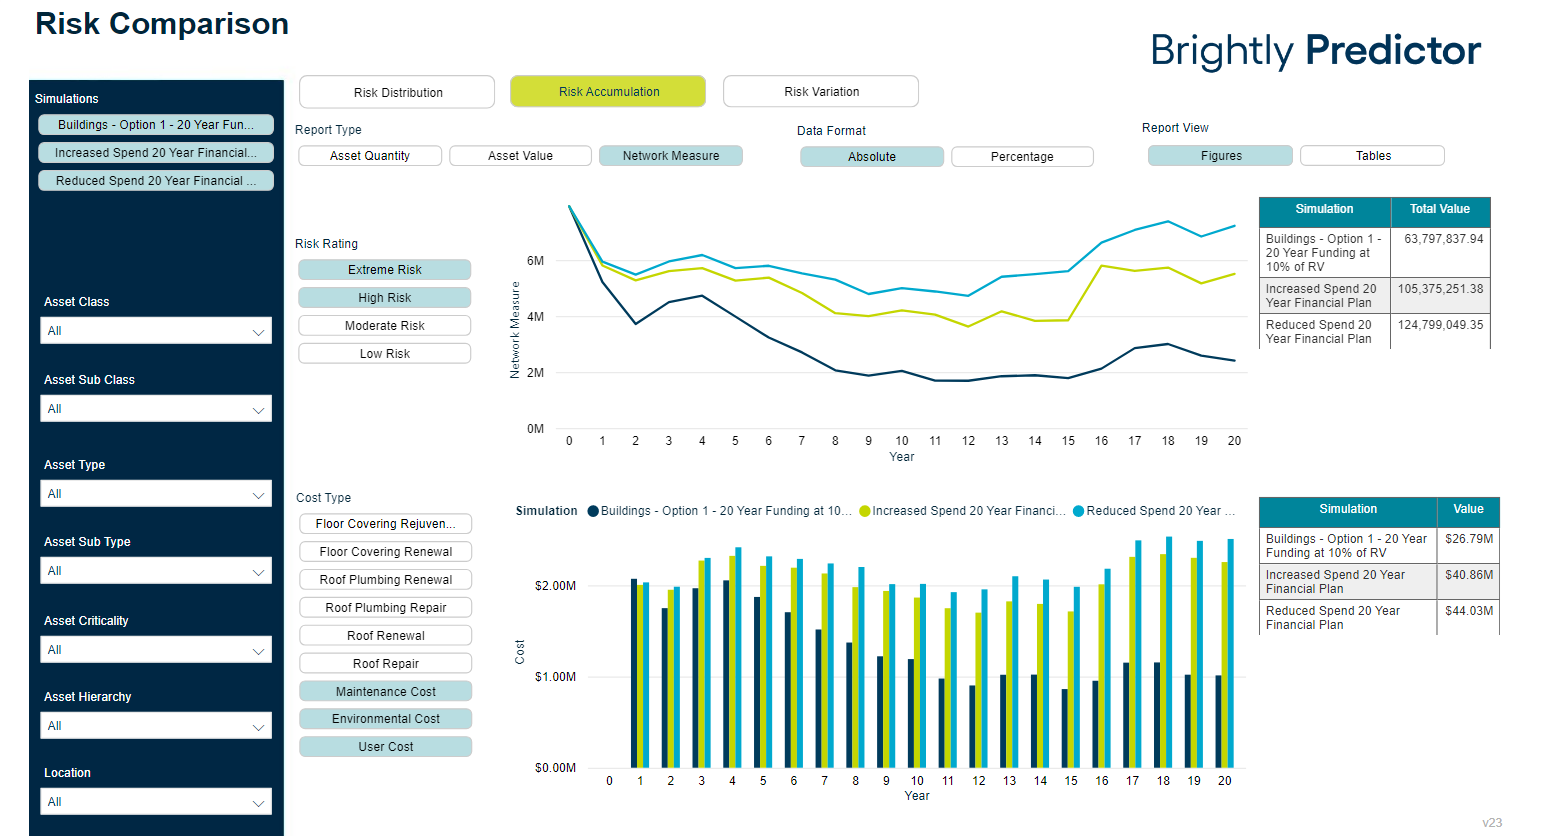
In the Risk Accumulation view, users can see how the Risk changes over the course of the Simulation.
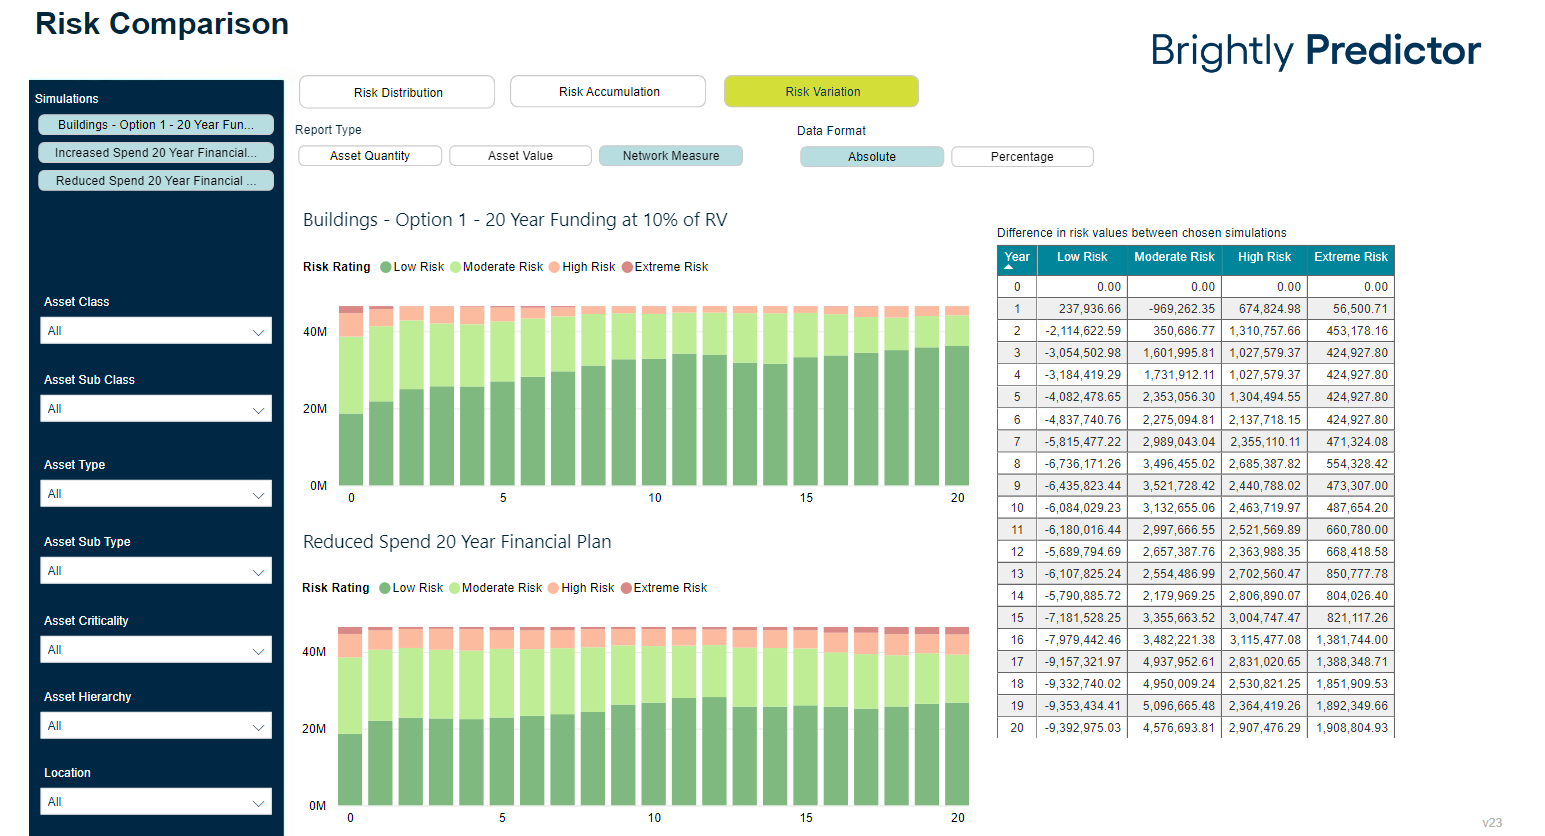
In the Risk Variation view, the difference and change in Risk Ratings over time is shown: